First Pages with Epyk
It is possible to implement simple static page to rich and interactive ones. Epyk will provide interfaces to components and events which can be used as an simple interface to a model or data source to a more complex ones interacting with any backend servers.
Warning
The line page.outs.jupyter() need to be added to run in online Jupyter notebooks.
Step-by-step
Simple Page
Let’s start with simple chart with the hard coded values, to do so we will add components available to page.ui:
import epyk as pk

data = [
    {"x": "label 1", "y": 23},
    {"x": "label 2", "y": 10},
]
page = pk.Page()
page.ui.charts.chartJs.line(data, y_columns=["y"], x_axis="x")
Note
By convention common components are attached directly to the page.ui property.
Plural names are used by convention to provide different flavour of them page.ui.fields
Changing style
The below will change the color of the lines:
import epyk as pk

data = [
    {"x": "label 1", "y": 23, "y2": 53},
    {"x": "label 2", "y": 10, "y2": 26},
]
page = pk.Page()
chart = page.ui.charts.chartJs.line(data, y_columns=["y", "y2"], x_axis="x")
chart.colors(["red", "green"])
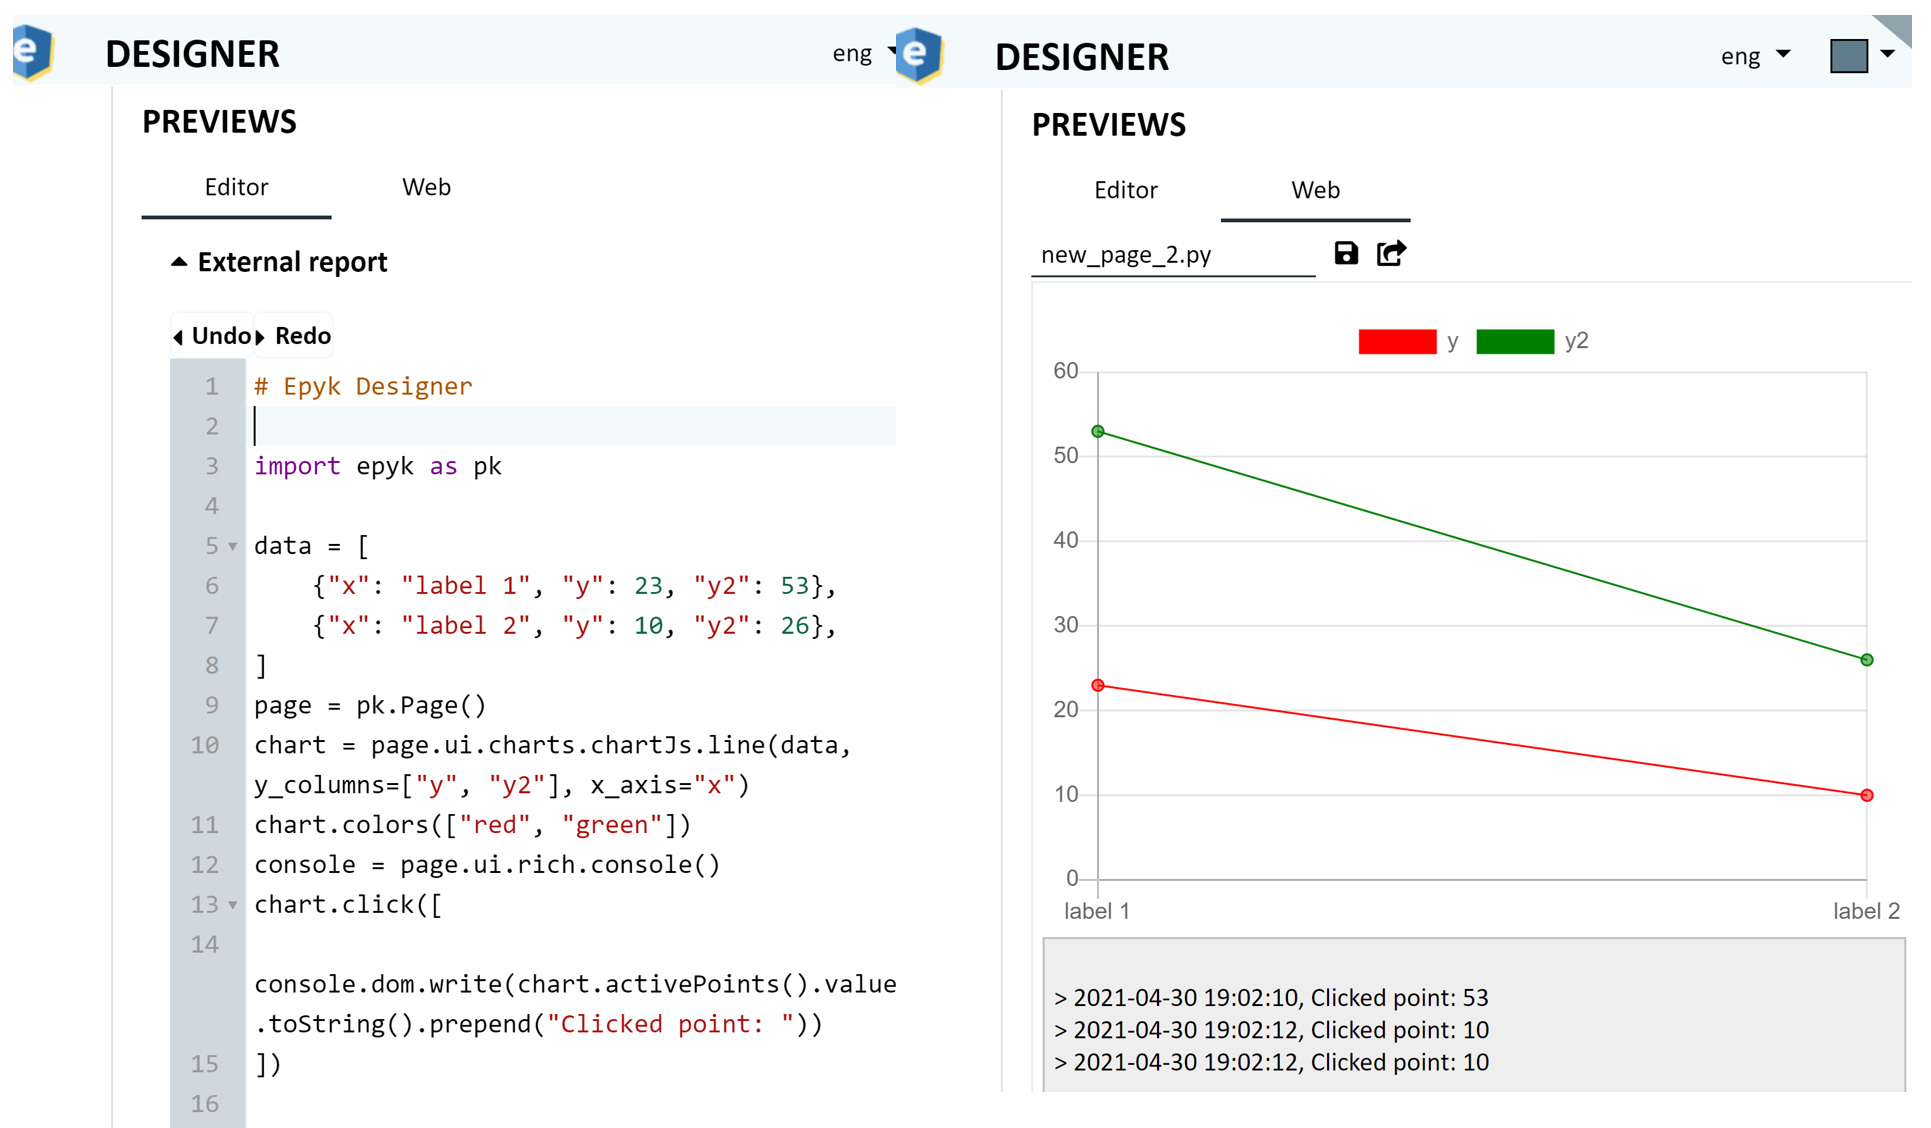
Adding events
This will create:
import epyk as pk

data = [
    {"x": "label 1", "y": 23, "y2": 53},
    {"x": "label 2", "y": 10, "y2": 26},
]
page = pk.Page()
chart = page.ui.charts.chartJs.line(data, y_columns=["y", "y2"], x_axis="x")
chart.colors(["red", "green"])
console = page.ui.rich.console()
chart.click([
   console.dom.write(chart.activePoints().value.toString().prepend("Clicked point: "))
])
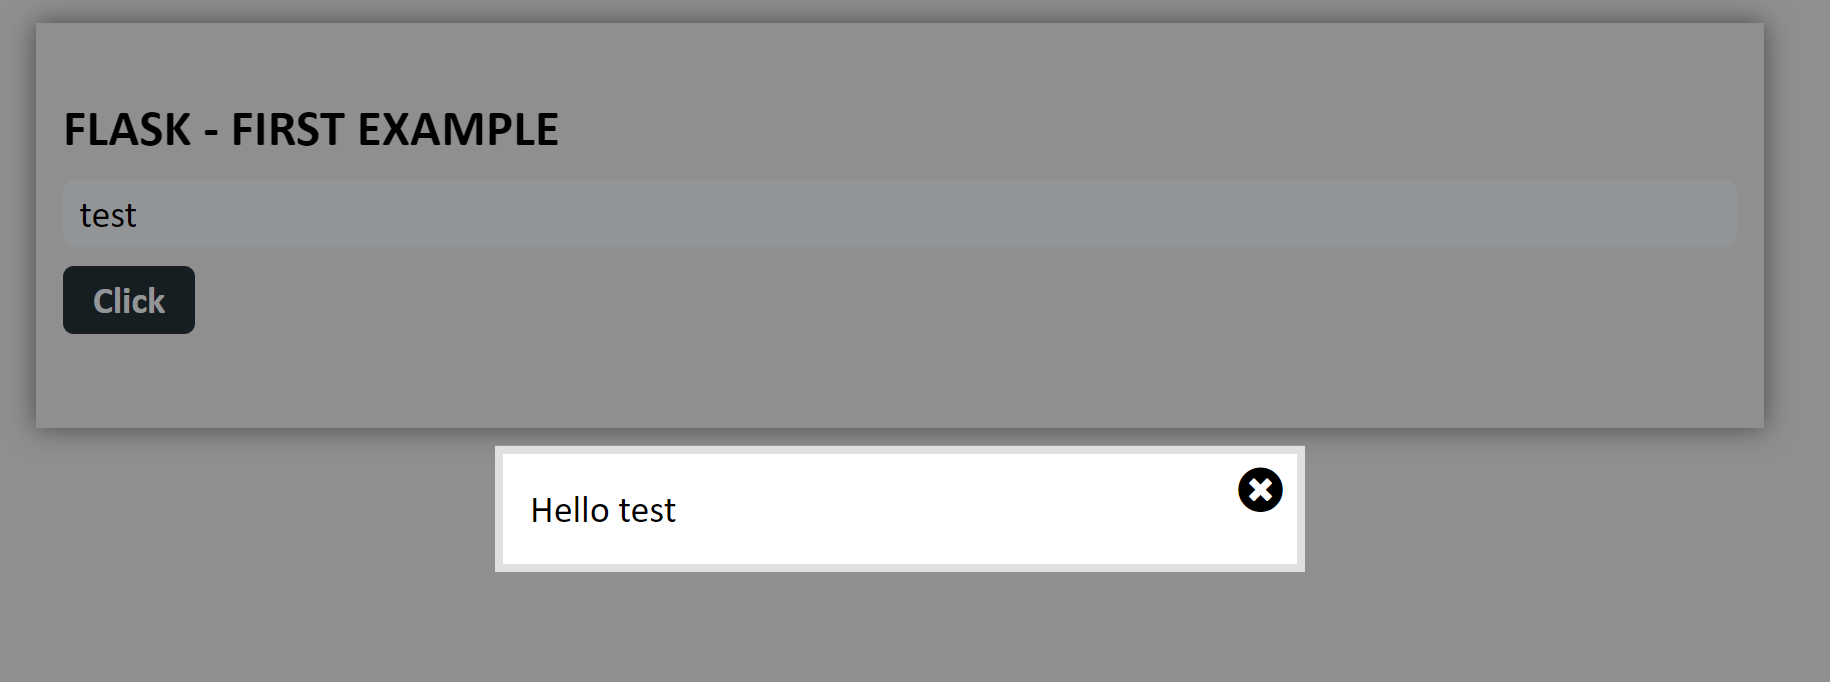
Using external API
This will create:
import epyk as pk

# Socket server url
SERVER_SOCKET_HOST = "127.0.0.1"
SERVER_SOCKET_PORT = 5000

from flask import Flask
app = Flask(__name__)


def create_page():
  page = pk.Page()
  page.headers.dev()

  title = page.ui.title("Flask - First example")
  input = page.ui.inputs.left(placeholder="Enter your name", html_code="msg")
  button = page.ui.buttons.colored("Click")
  text = page.ui.text()
  simple_modal = page.ui.modals.popup([text])
  input.enter([button.dom.events.trigger("click")])
  button.click([page.js.post("/test_event", components=[input]).onSuccess([
    text.build(pk.events.data["message"]),
    simple_modal.dom.show()
  ])])

  box = page.ui.div()
  box.extend([title, input, button])
  box.style.configs.doc()
  return page


if __name__ == "__main__":
  from flask import Flask, jsonify, request

  @app.route('/')
  def ui():
    return create_page().outs.html()

  @app.route('/test_event', methods=['POST'])
  def test_event():
    data = request.get_json()
    return jsonify({"message": "Hello %s" % data['msg']})

  Flask.run(app, host=SERVER_SOCKET_HOST, port=SERVER_SOCKET_PORT, debug=True)
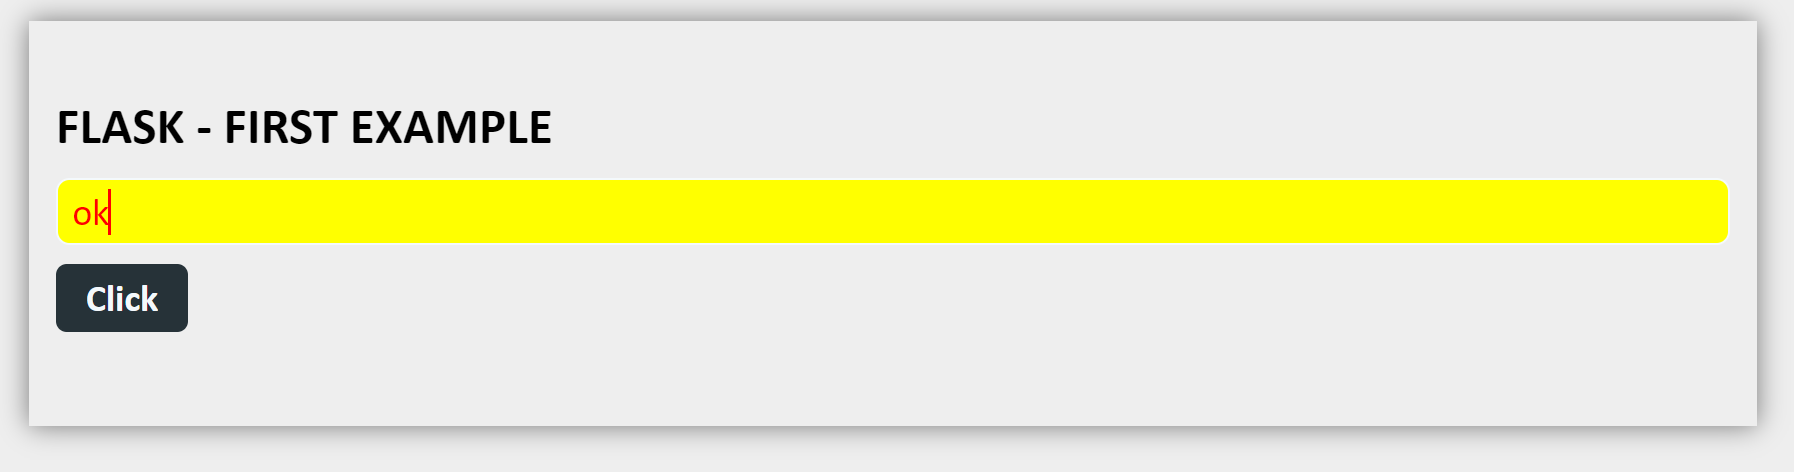
In the above example it is possible to change all the CSS properties of the compontents. For example, the below will change the color and the background color:
input = page.ui.inputs.left(placeholder="Enter your name", html_code="msg")
input.style.css.color = "red"
input.style.css.background = "yellow"
Offline mode
It is possible to run offline but this will require to get the list of external packages downloaded first.
To do so from a script some functions and CLI are embedded in the library.
Get the list of requirements.
At the end of any script is it possible to call page.imports.requirements to get the list of all the external packages.
This will return the different alias (the npm aliases) used to defined an external package (some JavaScript and CSS pages):
page = pk.Page()
page.headers.dev()

page.body.template.style.configs.doc(background="white")
...

print(",".join([r for r in page.imports.requirements]))

epyk_npm.exe install -pkg=promise-polyfill,@popperjs/core,bootstrap,showdown,jquery,accounting,tabulator-tables,moment,chart.js
Install the packages locally
A CLI is available to install all the packages to a dedicated path:
epyk_npm.exe install -pkg=promise-polyfill,@popperjs/core,bootstrap,showdown,jquery,accounting,tabulator-tables,moment,chart.js
By default this will download the package and create a statics folder at the root
Set a offline mode
Then change the outs definition to set the path of the external packages:
page.imports.static_url = "C:\epyks\statics"
page.outs.html_file(name="test.html", options={"split": True, "minify": False, "static_path": page.imports.static_url})
In the function page.outs.html_file some options are available to split the outputs and change the formatting.
Other use cases
Epyk can be used to do more complicated dashboards with multiple events and interaction wiht the backend server.
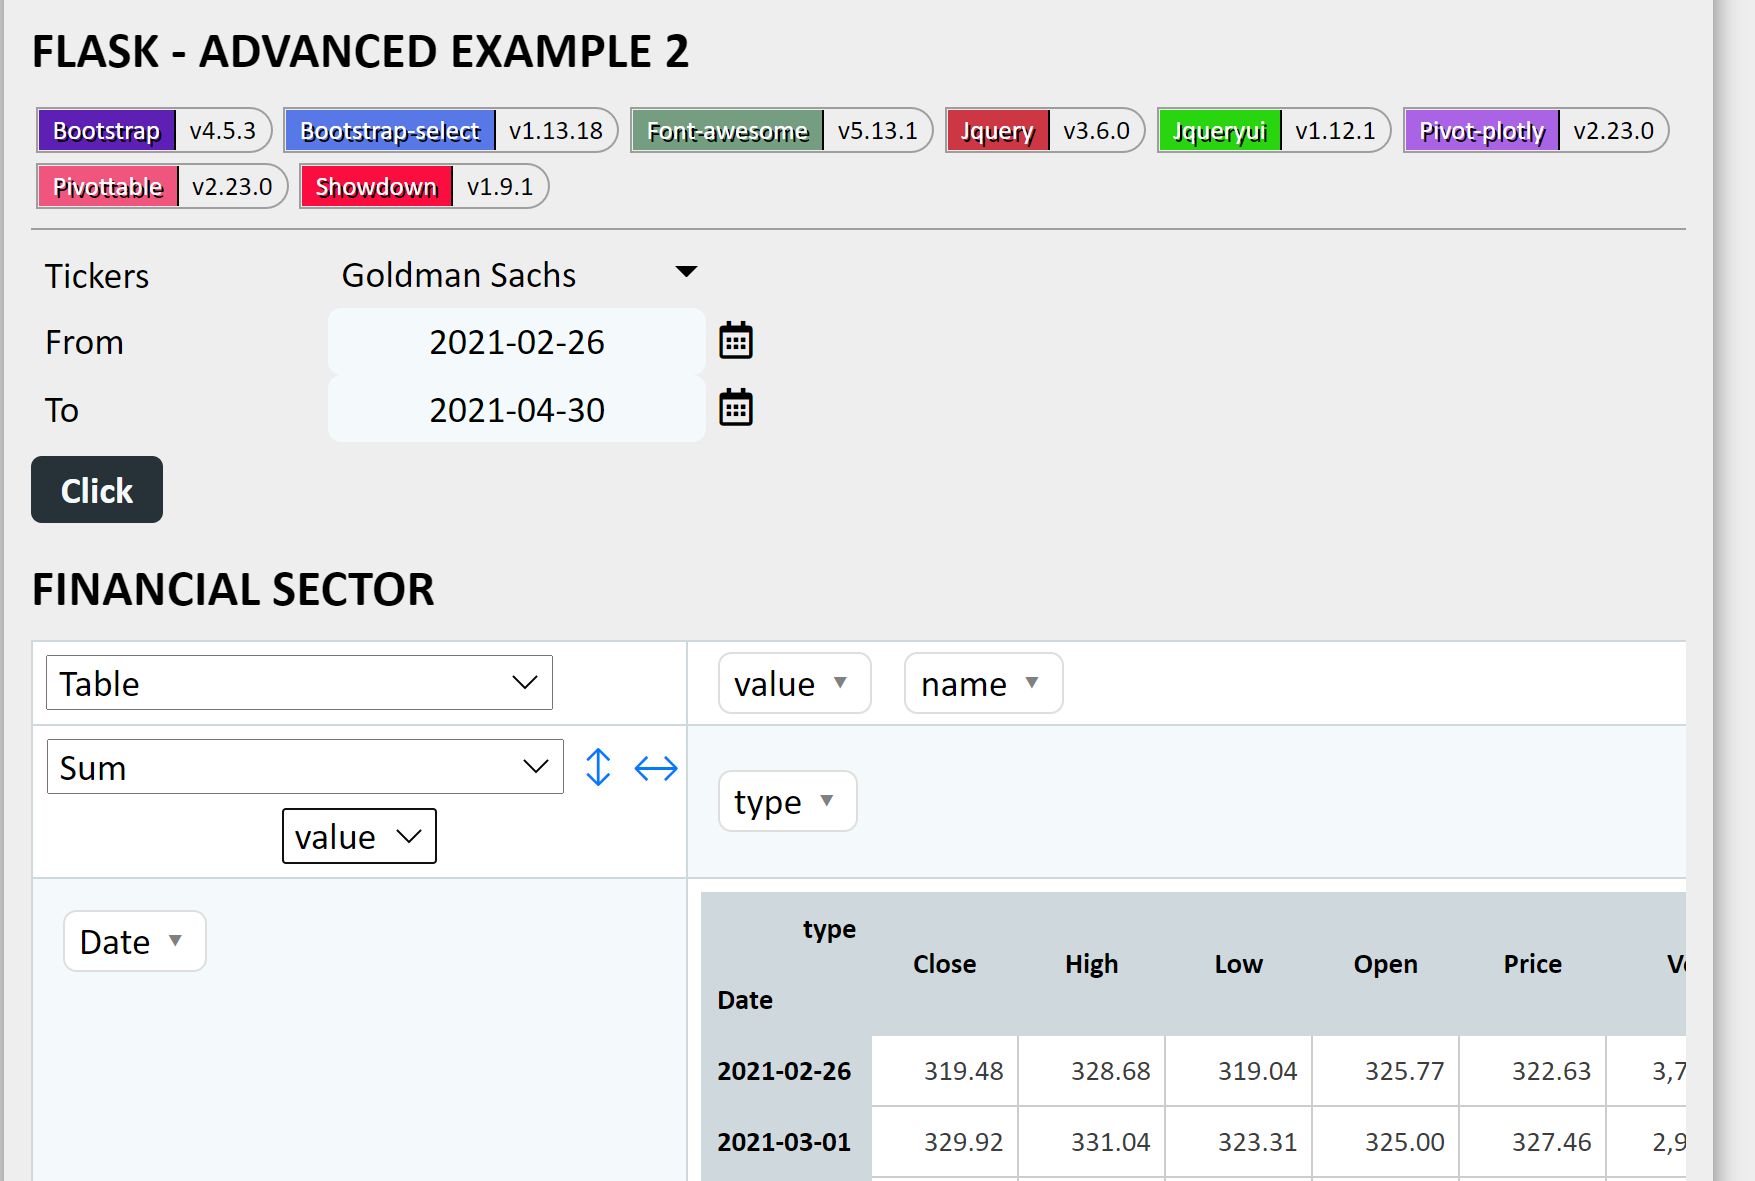
Dashboards
This one will get data from datareader and return the result to be then display in a pivotTable. To insert those dependencies to the final web page it is only required to call those objects from the ui interfaces.
Thus we can find the below pieces in the code:
ticker = page.ui.fields.select(
cpns.select.from_dict(tickers_info), label="Tickers", multiple=True, html_code="ticker_value")

....

pivot = page.ui.tables.pivots.plotly()
E-commerce
Using standard IDE
Epyk can be used in any IDE and it will provide autocompletion to simplify the implementation.
Caution
Include paths are relative to the file in the document project, not the file in shared content.