Getting started with Epyk
Epyk is designed for Python developers or users interested in implementing an entire product without having to change technologies.
What is Epyk?
Epyk is an OpenSource library designed to improve time to market for Data Scientists and any people eager to prototype a new / or an extension to a product in a quite flexible manner.
The main targets of Epyk are to:
Allow Python developers to present and share their work to users.
Simplify the prototyping by using components and templates.
Easy to start for beginners.
Help to ramp up with web technologies by learning those concepts.
Be used as a web toolbox to improve time to market and the learn web technologies.
Installation
Assuming you have Python already, install Epyk:
pip install epyk
Create a directory inside your project to hold your ui and run the epyk-new command::
epyk.exe new
This command will create a first empty report in your folder. Then the below command will convert (transpile) it to a web page:
epyk.exe transpile
See also
More details on the CLI Features.
For a quick examples it is possible to use the below CLI:
epyk.exe demo
The will generate the below script epyk_demo.py in the current directly:
epyk.exe transpile -n=epyk_demo
This script will demo some common features available in the library:
import epyk as pk

# Module with mock data
from epyk.tests import mocks

# Create a basic report object
page = pk.Page()
page.headers.dev()

page.body.template.style.configs.doc()

# Change the CSS style of the div template container
page.body.template.style.css.background = "white"

table = page.ui.table(mocks.popularity_2020)
table.options.paginationSize = 10

toggle = page.ui.toggle({"on": "Trend", "off": "Share"})
bar = page.ui.charts.bar(mocks.popularity_2020, y_columns=["Share"], x_axis="Language")

toggle.click([
  # Store the variable to myData on the JavaScript side
  pk.std.var("myData", sorted(mocks.popularity_2020, key=lambda k: k['Language'])),
  # Use the standard build and dom.content to respectively update and get the component value
  pk.expr.if_(toggle.input.dom.content.toStr(), [
    # Use the variable to update the chart
    bar.build(pk.std.var("myData"), options={"y_columns": ["Trend"]})
  ]).else_([
    bar.build(pk.std.var("myData"), options={"y_columns": ["Share"]})
  ])
])
Another example is available in the Github templates repo to illustrate how to adapt a script to backend services. Very few changes are required to add a backend post to an underlying service:
toggle.click([
  page.js.post("/data", components=[toggle.input]).onSuccess([
    bar.build(pk.events.data["chart_data"], options={"y_columns": pk.events.data["columns"]})
  ])
])
Dependencies
Epyk does not require any python dependency. The idea of this library is to code with any packages or frameworks used in both Python and JavaScript side. Thus it will not impose any library to run. Obviously component are done in a way to deal with records (list of dictionaries) which are common objects in Pandas.
The only thing required to work is an internet connection to be able to retrieve the external packages on which Epyk leverage to render the page.
Those packages are not part of the project and they are developed independently.
See also
his is not a new Visualisation library with some core Javascript embedded modules, this is a unique library which link your python code to external and already popular JavaScript and CSS packages
First Page
In Epyk the object used to create the final web page is called a Page. The page object will be the one available to each component in charge of triggering the .html() on each components.
The unique page object will store all the components in a page.components dictionary. Each component will be in charge of defining its JavaScript bindings, its HTML5 structure and also its need in external resources guides/component-structure.
Quick start
The below will illustrate how to start with Epyk and build your first report. This will write the web artifacts locally:
import epyk as pk

page = pk.Page()
text = page.ui.text("This is a test")
text.click([page.js.alert("This is an alert")])
page.outs.html()
the last line page.outs.html() is important since it will produce the final web files which can be used in a browser. It will be very often not mentioned in the examples because this can vary according to the framework used.
In the below example page.outs.jupyter() is used instead to render the example from an online session of Jupyter notebook.
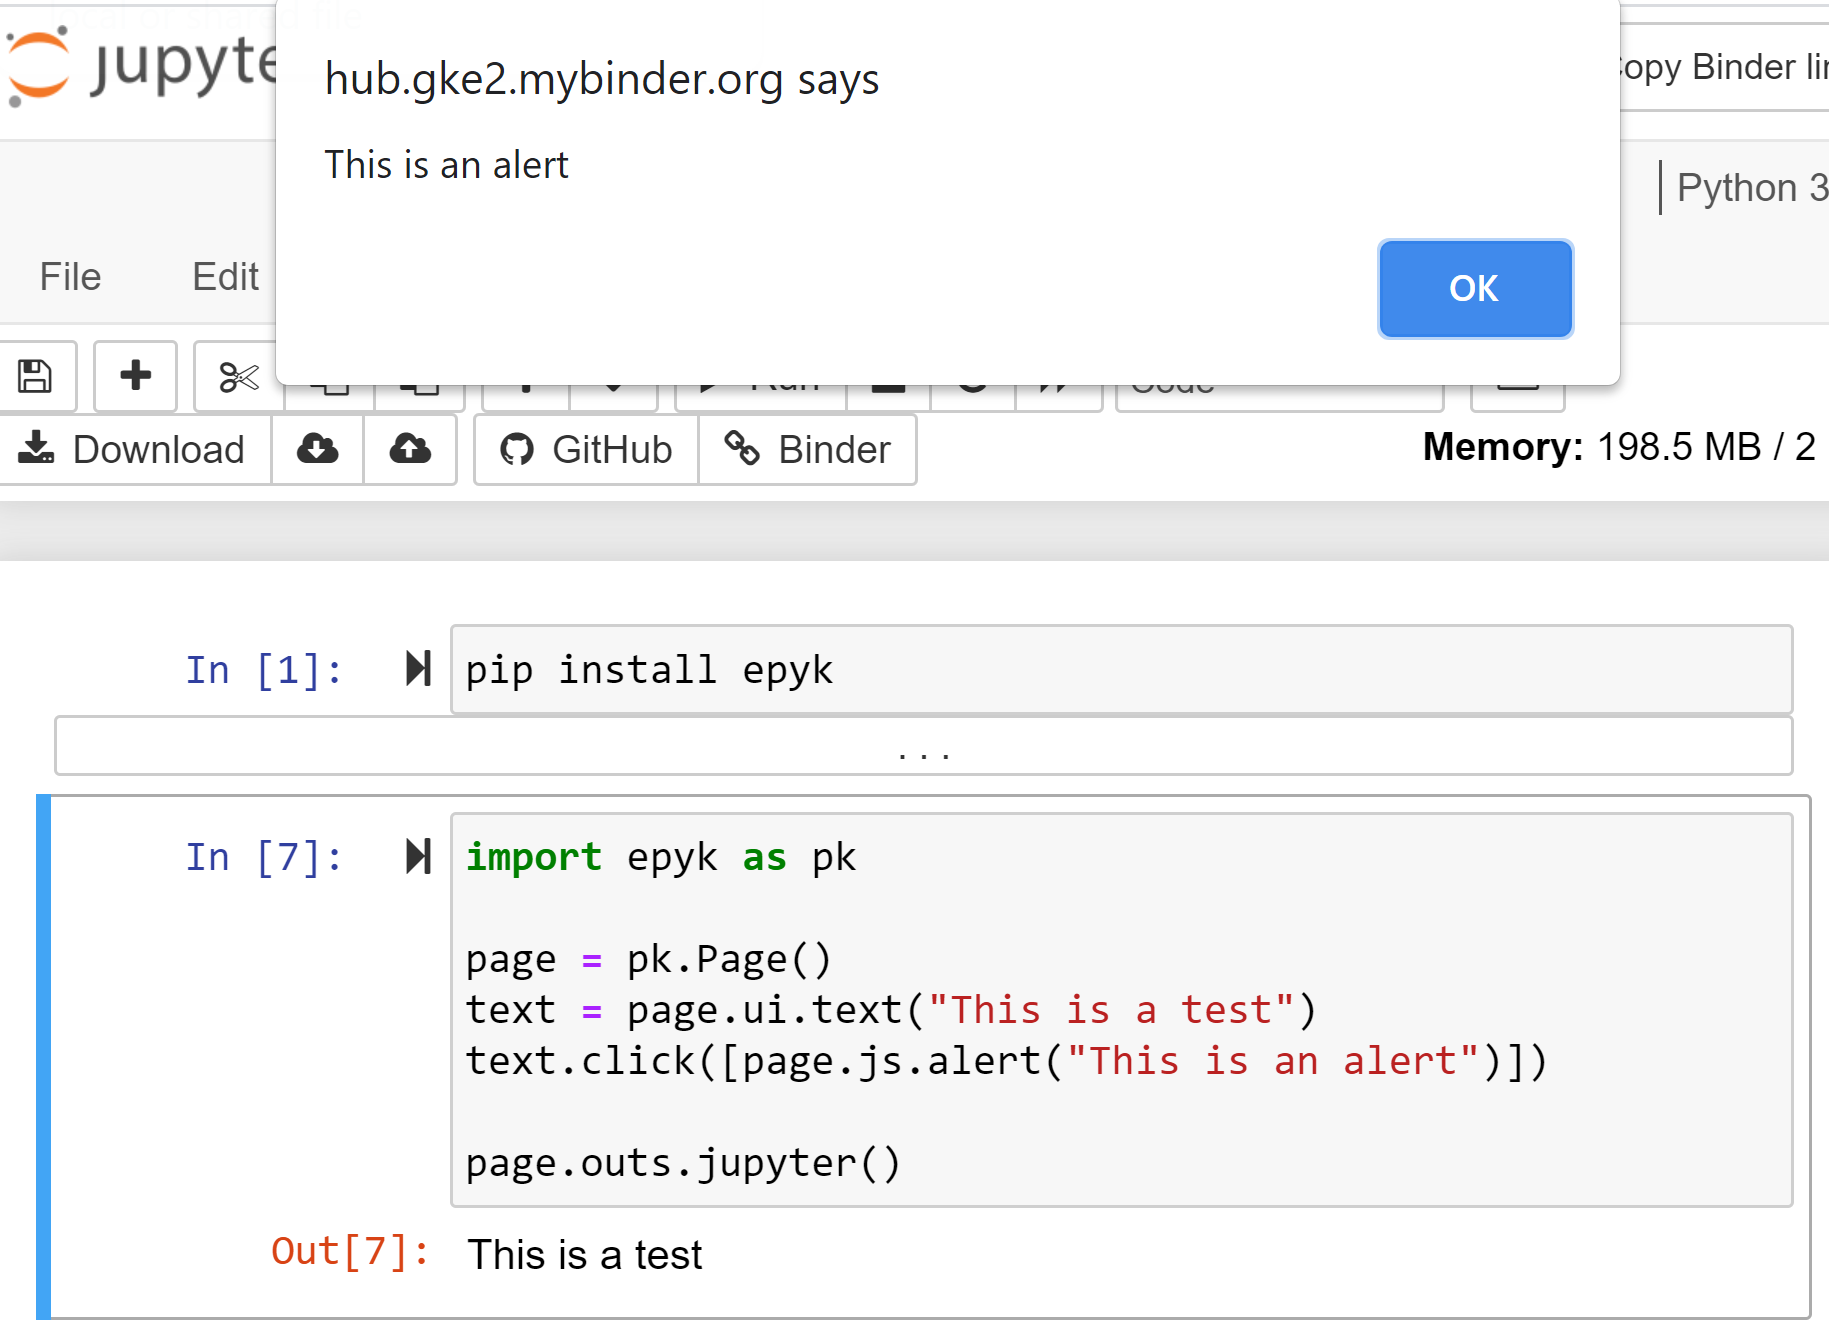
Also this is not needed if you use the CLI Features to render the page.
The best to get more familiar with Epyk is to use PyCharm and the code autocompletion or to start with examples on the template Github repository
Web Development
From Epyk it is possible to interface any Python project using any Backend technology. It can be used like Jinja to render rich HTML content on the fly.
The below example illustrate how to generate an interactive dashboard with few lines of codes and without any server:
page = pk.Page()
#page.theme.color_palette("brewer.PuBu8")

# Set the page layout
template = page.body.add_template(defined_style="doc")
template.style.css.background = page.theme.greys[0]

page.ui.title("Pandas tutorial #5")
page.ui.texts.references.website(url="https://towardsdatascience.com/data-visualization-with-bokeh-in-python-part-ii-interactions-a4cf994e2512")
source_data = "https://raw.githubusercontent.com/WillKoehrsen/Bokeh-Python-Visualization/master/interactive/data/complete_flights.csv"

df = pd.DataFrame(page.py.requests.csv(source_data, store_location=r"C:\tmps"))
df["dep_delay"] = pd.to_numeric(df["dep_delay"], downcast="float")
df["distance"] = pd.to_numeric(df["distance"], downcast="float")
agg_df = df.groupby(["name", "month", "distance"])["dep_delay"].sum()
agg_df = agg_df.reset_index()

max_value = float(df["distance"].max())
checks = page.ui.lists.checks(list(df["name"].unique()))
dist = page.ui.fields.static("[0, %s]" % max_value, label="Min, Max distance")
slider = page.ui.sliders.range([0, max_value], maximum=max_value)

chart = page.ui.charts.chartJs.bar(y_columns=["dep_delay"], x_axis="month")
table = page.ui.table(rows=["name", "month", "distance"], cols=["dep_delay"])
table.config.pagination = "local"
table.config.paginationSize = 10

pie = page.ui.charts.chartJs.pie(y_columns=["dep_delay"], x_axis="name")
pie_count = page.ui.charts.chartJs.pie(y_columns=["count"], x_axis="name")

grp = page.data.js.record(agg_df.to_dict(orient="records")).filterGroup("aggData")
grp2 = page.data.js.record(agg_df.to_dict(orient="records")).filterGroup("aggData2")

update_button = page.ui.buttons.colored("update")

row = page.ui.row([[checks, update_button], chart], position="top")
row.set_size_cols(4)

total_delay = page.ui.titles.subtitle("Total Delay")
count_delay = page.ui.titles.subtitle("Count Delay")
page.ui.row([[total_delay, pie], [count_delay, pie_count]], position="top")

toggle = page.ui.buttons.toggle({'on': "More than 3 hours", 'off': 'All delays'}, label="Delay Type",)

hamburger = page.ui.panels.hamburger([dist, slider, toggle], title="Details")
table.move()

page.ui.layouts.hr()
page.ui.titles.subtitle("Report powered by")
page.ui.rich.powered()
The below will add the interactivity and the JavaScript data transformation:
toggle.input.click([
  page.js.if_(
    toggle.input.dom.content.isTrue(), [
      chart.build(grp.includes("name", checks.dom.content, empty_all=False).sup("dep_delay", 180).sup("distance", slider.dom.min_select).inf("distance", slider.dom.max_select).group().sumBy(["dep_delay"], ["month"], cast_vals=True)),
      table.build(grp.includes("name", checks.dom.content, empty_all=False).sup("dep_delay", 180).sup("distance", slider.dom.min_select).inf("distance", slider.dom.max_select)),
      pie.build(grp.includes("name", checks.dom.content, empty_all=False).sup("distance", slider.dom.min_select).inf("distance", slider.dom.max_select).group().sumBy(["dep_delay"], ["name"], cast_vals=True)),
      pie_count.build(grp.includes("name", checks.dom.content, empty_all=False).sup("distance", slider.dom.min_select).inf("distance", slider.dom.max_select).group().countBy(["name"]))
    ]).else_([
      chart.build(grp2.includes("name", checks.dom.content, empty_all=False).sup("distance", slider.dom.min_select).inf("distance", slider.dom.max_select).group().sumBy(["dep_delay"], ["month"], cast_vals=True)),
      table.build(grp2.includes("name", checks.dom.content, empty_all=False).sup("distance", slider.dom.min_select).inf("distance", slider.dom.max_select)),
      pie.build(grp2.includes("name", checks.dom.content, empty_all=False).sup("distance", slider.dom.min_select).inf("distance", slider.dom.max_select).group().sumBy(["dep_delay"], ["name"], cast_vals=True)),
      pie_count.build(grp2.includes("name", checks.dom.content, empty_all=False).sup("distance", slider.dom.min_select).inf("distance", slider.dom.max_select).group().countBy(["name"]))
  ]),
  dist.input.build(slider.dom.content)
])

# Reuse the code generated by the toggle click for the below components.
update_button.click(toggle.input.event_fnc("click"))
slider.change(toggle.input.event_fnc("click"))
By adding page.outs.html() it will generate a file which can be opened in a browser